
System information
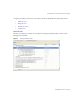

Using the Profiler to Troubleshoot Performance Problems
Part Number 820-2952-10 Page 169
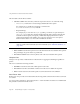
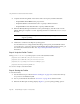
c. When the Process Diagram displays, return to the Identity Manager IDE and click Take
Snapshot in the Profiling Results section.
Figure 10
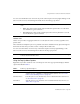
8.
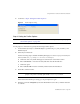
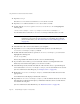
The Identity Manager IDE downloads your snapshot and displays the results on the right
side of the window.
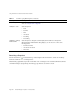
Figure 11 Call Tree Results
This area is the Call Tree view. At the top of the Call Tree, you should see a
/idm/task/taskLaunch.jsp
with a time listed in the Time column. The time should
indicate that the entire request took six+ seconds.
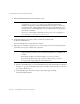
9. Expand the
/idm/task/taskLaunch.jsp
node, and you can see that
ProfilerTutorialWorkflow1 took six seconds.
10. Expand the
ProfilerTutorialWorkflow1
node. Note that
activity2
took four seconds and
activity1
took two seconds.