
System information
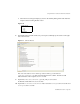

Using the Profiler to Troubleshoot Performance Problems
Page 168 Identity Manager 7.1 Update 1 • Release Notes
5. When the Identity Manager window displays, log in.
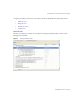
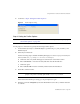
6. In Identity Manager, select Server Tasks > Run Tasks, and then click
ProfilerTutorialWorkflow1.
The tutorial might take a few moments to respond.
7. Although you could take a snapshot now; you are going to reset your results instead, run
the Profiler, run it again, and then take a snapshot.
a. Return to the IDM Profiler view in the Identity Manager IDE. Click the Reset Collected
Results icon in the Profiling Results section (or in the Controls section) to reset all of
the results collected so far.
b. In Identity Manager, select Server Tasks > Run Tasks again, and click
ProfilerTutorialWorkflow1.
NOTE Typically, you should log in to Identity Manager as a different user instead
of logging in as
configurator
again. You are already logged into the
Profiler as configurator, and the Identity Manager session pool only allows
one entry per user. Using multiple entries can result in the appearance of a
broken session pool and might skew your profiling results for finer-grained
performance problems.
However, for this simple example the session pool is of no consequence so
you can login as
configurator
/
configurator
.
NOTE It is a best practice to run the Profiler a couple of times before taking a
snapshot to be sure all the caches are primed, all the JSPs are compiled, and
so forth.
Running the Profiler several times enables you to focus on actual
performance problems. The only exception to this practice is if you are
having a problem populating the caches themselves.