
System information

Using the Profiler to Troubleshoot Performance Problems
Page 164 Identity Manager 7.1 Update 1 • Release Notes
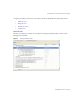
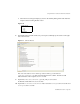
Searching a Snapshot
Use the Search icon , located at the top of the Snapshot View window to search for nodes by
name the Call Tree view or Hotspots tree.
Alternatively, right-click any node in Call Tree view or Hotspots view and select Find in Call Tree
or Find in Hotspots (respectively) from the pop-up menu to search for a node.
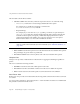
Find In Hotspots Select this option to find a node in the Hotspots view. For detailed information about this
view, see “Hotspots View” on page 162.
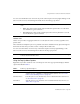
List Options > Sort > Select this option to
•None
• Call Tree
•Time
• Invocations
• Ascending
• Descending
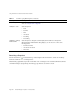
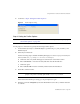
List Options > Change
Visible Columns
Select this option to change the columns displayed in the Call Tree or Hotspots list.
When the Change Visible Columns dialog displays, you can select one or more of the
following options:
• Call Tree: Call Tree
• Invocations: Invocations
•Time: Time
Table 7 Profiler Pop-Up Menu Options (Continued)
Menu Options Description