
System information

Using the Profiler to Troubleshoot Performance Problems
Part Number 820-2952-10 Page 163
You can access the Back Traces view from any of the other snapshot views by right-clicking a node
(known as the root node) and selecting Show Back Traces from the pop-up menu.
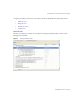
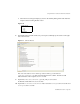
Callees View
Callees view provides an aggregate call tree for a node (known as the root node), regardless of its
parent chain.
These statistics are helpful if you have a problem area that is called from many places throughout
the master call tree and you want to see the overall profile for that node.
You can access the Callees view from any of the other snapshot views by right-clicking a node
(known as the root node) and selecting Show Callees from the pop-up menu.
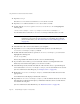
Using the Pop-Up Menu Options
Right-click any node in Call Tree view or in Hotspots view and a pop-up menu displays with the
options described in Table 6:
NOTE The Time and Invocations data values mean something different in Back Traces
view:
• Time: The values in this column represent the time spent in the root node when
it is called from a given call chain.
• Invocations: The values in this column represent how many times the root node
was invoked from a given call chain.
NOTE The Time and Invocations data values used in Callees view have the same meaning
as those used in Call Tree view.
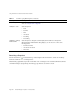
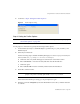
Table 7 Profiler Pop-Up Menu Options
Menu Options Description
GoTo Source Select this option to view the XML source for a node that corresponds to a Java method,
workflow, form, rule, or XPRESS. For detailed information about this view, see “How the
Profiler Locates and Manages Source” on page 148.
Show Back Traces Select this option to access the Back Traces view. For detailed information about this view,
see “Back Traces View” on page 162.
Show Callees Select this option to access the Callees view. For detailed information about this view, see
“Callees View” on page 163.