
System information

Using the Profiler to Troubleshoot Performance Problems
Page 162 Identity Manager 7.1 Update 1 • Release Notes
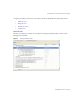
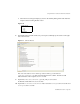
This tree table contains three columns:
• Call Tree column: Lists all nodes, where the top-level nodes are one of the following:
❍
Thread.run()
methods for various background threads in the system.
For example, if you enable Java profiling, you will see the
ReconTask.WorkerThread.run()
method.
❍ Request timings
For example, if you view the
idm/login.jsp
URL, you will see a top-level entry for
idm/login.jsp
. For this entry, the data displayed in the Time column represents the
total time for that request (or requests), and the data displayed in the Invocations
column represents the total number of invocations to that page. You can explore
further into that data to see what calls contributed to its time.
• Time column: Lists the time spent in each node when that node was called from its parent.
The percentages are given relative to parent time.
• Invocations column: Lists how many times each node was invoked from its parent.
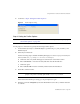
Hotspots View
Hotspots view provides a flattened list of nodes that shows aggregate call timings regardless of
parent.
This view contains the following columns:
• Self Time: Lists the total amount of time spent in each node.
• Invocations: Lists the total number of times each node was invoked from its parent.
• Time: Lists the total amount of time spent in each node and in all of its children.
Back Traces View
Back Traces view provides an inverted call stack showing all the call chains from where each node
was called.
You can use these statistics to answer the question — How much time would I save if I eliminated
this particular call chain from this node?
NOTE The Call Tree also contains Self Time nodes. Self Time values represent how much
time was spent in the node itself. (For more information, see “Self Time Statistics” on
page 150.)