
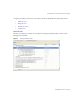
System information

Using the Profiler to Troubleshoot Performance Problems
Part Number 820-2952-10 Page 161
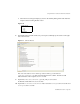
A snapshot provides several views of your data, which are described in the following sections:
• Call Tree View
• Hotspots View
• Back Traces View
• Callees View
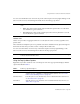
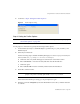
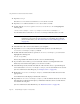
Call Tree View
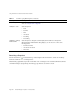
Call Tree view (Figure 5) consists of a tree table showing the call timing and invocation counts
throughout your system.
Figure 6 Example Call Tree View