
System information

Using the Profiler to Troubleshoot Performance Problems
Part Number 820-2952-10 Page 149
For Forms, Rules, Workflows, and XPRESS Objects
When you take a snapshot with the Profiler, the server evaluates all of the profiling data and
discovers on which sources the data depends. The server then fetches all of these sources from the
repository and includes them in the snapshot. Consequently, you can be sure that the Identity
Manager objects displayed in the snapshot are accurately reflecting the point at which the snapshot
was captured.
This process adds to the size of the snapshot, but the source size is actually a relatively small
fraction of the total size. As a result, you can send a snapshot to Sun’s Customer Support without
having to send your source files separately.
For Java Source
When you take a snapshot of Java source, the client downloads the snapshot and then goes through
the snapshot to capture all referenced Java sources from the project. When you save the snapshot,
the client zips the sources and attaches them to the end of the snapshot.
Then, when you view the snapshot and go to the Java source, the client first checks the content of
the snapshot. If the client cannot find the content there, it checks the project’s content. This process
allows you to send a snapshot containing profiling data from both your custom Java code and
Identity Manager code.
Statistics Caveats
The following sections contain information to consider when you evaluate results provided by the
Profiler:
• Self Time Statistics
• Constructor Calls
• Daemon Threads
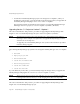
TIP In Call Tree view or Hotspots view, you can double-click any node that corresponds
to a Java method, workflow, form, rule, or XPRESS to view the source for that node.
NOTE In a Java source snapshot, do not assume the source is up-to-date with the server or
always available.