
System information

Using the Profiler to Troubleshoot Performance Problems
Page 148 Identity Manager 7.1 Update 1 • Release Notes
❍ Call Tree view provides a tree table showing the call timing and invocations counts
throughout the system.
❍ Hotspots view provides a flattened list of nodes that shows the aggregate call timings
regardless of parent.
❍ Back Traces view provides an inverted call stack showing all the call chains from
which that node (known as the root node) was called.
❍ Callees view provides an aggregate call tree of the root node, regardless of its parent
chain.
• Specify what kinds of information to include in your snapshot:
❍ You can include every element of form, workflow, and XPRESS or restrict the content
to a set of specific elements.
❍ You can pick specific Java methods and constructors to include or exclude from the
instrumentation. Instrumentation of Identity Manager classes and custom classes is
supported.
• Manage your project snapshots as follows:
❍ Save the snapshot in your project’s
nbproject/private/idm-profiler
directory or to
an arbitrary location outside of your project.
❍ Open snapshots from your project or load them from an arbitrary location outside your
project.
❍ Delete snapshots.
• Search for specific nodes, by name.
How the Profiler Locates and Manages Source
This section describes how the Profiler looks up and manages the source for the following Identity
Manager objects:
• For Forms, Rules, Workflows, and XPRESS Objects
• For Java Source
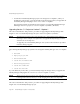
NOTE You can view a list of all saved snapshots in the Saved Snapshots
section of the IDM Profiler view.