
REC245PE PV Module PAN Report


REC Solar US LLC | REC245PE PAN FILE DEVELOPMENT REPORT
BLACK & VEATCH | Results
2-5
TheresultsofBlack&Veatch’scomparativemetricsfor the Base Case PAN File (as defined in
Section 1.3) are shown in Table 3 below.
Table 3 Base Case PAN File Results
REC245PE
ROOT SUM SQUARE (RSS)
DEVIATION
ENERGY PRODUCTION
DIFFERENCE FROM LAS VEGAS
TEST CASE*
Base Case
1.94%
-3.69%
* A negative value indicates that the PAN file as generated will tend to
underestimate performance, while a positive value indicates that the PAN file will
overestimate performance
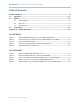
As shown in Table 3, the root sum square deviation between the Base Case and measured curves is
1.94%. Due to the deviation between the curves ,the Base Case efficiency curves underestimate
performance by 3.69% as compared to the measured curves using the temperature and plane-of-
array irradiance profile generated from the Las Vegas, NV Test Case.
2.3 OPTIMIZATION
Black & Veatch used a process to minimize RSS by refining the parameters which define the
optimized PAN file. This was done by varying series resistance, shunt resistance, P
mpp
temperature
coefficient and I
sc
temperature coefficient in PVsyst in order to adjust the optimized PAN file
efficiency curves to better represent the measured efficiency curves. Through this process Black &
Veatch identified series resistance as the key parameter that required adjustment in order to
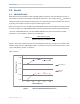
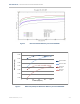
achieve optimization. This optimized input into PVsyst is summarized in Table 4. The efficiency
curves of the optimized PAN file from PVsyst are shown in Figure 4 and these are compared with
the measured and Base Case curves in Figure 5.
Table 4 Summary of Adjusted Inputs for Optimized PAN File
REC245PE
VALUE
Series Resistance R
s
(Ohm)
0.350