
REC245PE PV Module PAN Report


REC Solar US LLC | REC245PE PAN FILE DEVELOPMENT REPORT
BLACK & VEATCH | Approach
1-1
1.0 Approach
The purpose of this effort was to create a PVsyst-compatible PAN file that more accurately
represents a REC245PE module in operational conditions reducing the risk of production
estimation underperformance caused by misrepresentation of module performance. To improve
the accuracy of the PAN files, Black & Veatch developed the following approach:
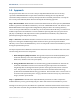
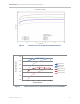
Step 1- Measured Data: Black & Veatch used measured data from the TÜV report for a REC240PE
module to generate scaled Measured efficiency curves for a REC245PE module. The TÜV test used
REC240PE modules before light-induced degradation (LID); therefore the resulting efficiency
curves are for pre-LID conditions. The efficiency curves describe module efficiency as a function of
module temperature and irradiance at various conditions spanning 200 watts per square meter
(W/m
2
) to 1,000 W/m
2
and temperatures of 25C (Standard Test Conditions, STC) and 45.72C
(Normal Operating Cell Temperature, NOCT).
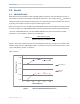
Step 2 – Base Case: The Module datasheet values were used to create a Base Case PAN file, which
PVsyst runs through its modified single diode model in order to generate expected module
efficiency curves. These modeled efficiency curves are compared to the measured efficiency curves
during the optimization process.
The expected performance difference between the measured curves and the Base Case curves was
assessed using two metrics for comparison:
1. Root Sum Square (RSS) Deviation: The agreement between the modeled (PAN file) and
measured efficiency curves was evaluated by analyzing the sum of the square of the
differences, called the root sum square (RSS).
2. Energy Production Test Case: The estimated energy production difference between the
measured and modeled scenarios was assessed using the temperature and irradiance-
weighted profile of a 20 degree fixed tilt system in Las Vegas, Nevada, known as the Test
Case. This provides a basis for comparison between the estimated measured energy
production and modeled PAN file energy production. Note that this metric is used in order to
characterize the potential impact to energy production estimates and may vary based on site,
design, and other system details.
Step 3 – Optimization: Black & Veatch adjusted PAN file parameters in order to adjust the
modeled efficiency curves generated by PVsyst to better match the measured efficiency curves.
Through an iterative process, the PAN file was optimized to minimize the deviation between these
curves, which was assessed using the RSS deviation and Test Case comparison described in Step 2.