
Whitepaper - Real World Performance


Performance compared to PVsyst prediction
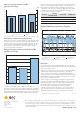
All three sections produced significantly more energy than the volume
predicted using PVsyst. The arrays outperformed the simulations by
. . percent – an average over-performance of . percent. This
trend is consistent with data measured in REC installations around
the world and observed by independent test institutes, internal
projects and satisfied system owners.
System level performance ratios of percent and above are
impressive considering the tropical climate in Singapore. Throughout
the duration of the test, the average ambient temperature was .°C,
with an average maximum temperature of .°C. As a result, module
temperatures frequently exceed °C and were at times as high as
°C. As is typical in tropical areas, Singapore is not only hot, but also
humid. Levels of humidity in Singapore reach on average percent
2
throughout the year which provides a challenging environment for
solar modules. The site’s yield complements REC’s first place ranking
at the Photon test site demonstrating high performance ratios in
tropical as well as temperate conditions.
Conclusion
For the three array sections totalling kW on the roof of the REC
integrated manufacturing facility, performance ratios of between .
. percent were recorded.
The purpose of this analysis was to determine real-world performance
of REC modules against that predicted by PVsyst. Through this
exercise it can be concluded that systems built with REC modules
can significantly outperform soware simulations and given the right
input assumptions and grid availability, can even be in excess of seven
percent above simulated predictions.
System designers are increasingly selecting photovoltaic modules
based upon yield rather than nameplate wa class. Superior design
and manufacturing are at the core of REC’s high-yield performance
and reliability. Due to inherent technological advantages, REC
modules provide yield advantages not only beyond market
competitors but above PVsyst predictions. These strong results in
a hot and humid environment complement those seen in Europe to
demonstrate REC’s superior energy performance in all conditions.
2BBC Weather: hp://www.bbc.co.uk/weather
Section
PVsyst
Simulated PR
Actual PR Difference
. . + .
. . + .
. . + .
Performance ratios in Singapore significantly exceed those predicted
Energy yield averages . higher than those simulated in PVsyst
7.3%
4.3%
4.7%
(%)
+ 0
+ 1
+ 2
+ 3
+ 4
+ 5
+ 6
+ 7
+ 8
Sect 3Sect 2Sect 1
Energy yield compared to PVsyst prediction in 2011
(excludes June & July)
Max Daily Temperature
(North) °C
Max Daily Temperature
(South) °C
Max Daily Ambient
Temperature °C
Daily maximum module & ambient temperatures recorded on-site
Month
(°C)
DecNovOctSepAugJulJunMayAprMarFebJan
20
30
40
50
60
70
80
Maximum 2011 daily temperatures in Singapore
June 2012
Renewable Energy Corporation ASA
Kjørboveien
PO Box
NO- Sandvika
Norway
Tel: +
www.recgroup.com
REC is a leading vertically integrated solar energy company. REC produces polysilicon, wafers, cells and modules
for the solar industry, and silicon materials for the electronics industry. REC also engages in project development
in selected PV segments. Founded in Norway in , REC employs around , people globally with revenues of
more than NOK billion in , approximately EUR . billion and USD . billion. Please visit www.recgroup.com
to learn more about REC.
Yield MWh
Measured system performance in 2011
(excludes June & July)
System performance for excludes June and July due to disruptions in data recording
Performance Ratio
84.9%
84.0%
83.0%
70
72
74
76
78
80
82
84
86
88
(%)
Sect 3Sect 2 Sect 1
0
10
20
30
40
50
60
MWh