
User guide

31
RaySafe i2 dose manager user manual – Get to know dose manager
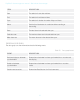
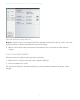
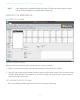
ITEM DESCRIPTION
Start The selection’s start date and time.
End The selection’s end date and time.
Span The selection’s duration in number of days and hours.
Name Sort the list of dosimeters in a selection either ascending or
descending.
Dose The total dose in the selected time span.
Peak dose rate The maximum dose rate in the selected time span.
Mean dose rate The mean dose rate in the selected time span.
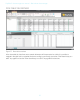
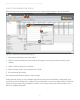
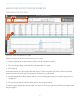
EVENTS IN A DOSE GRAPH
The dose graph can show information about the following events:
Table 23. Dose graph events
EVENT DESCRIPTION
Real time display to dosimeter
synchronization
Shows when a dosimeter has been synchronized via a occasions real
time display.
Cradle to dosimeter
synchronization
Shows when a dosimeter has been synchronized via a occasions
cradle.
Session reset occasions Shows when Dose Session 1 or 2 has been reset.