
User guide

30
RaySafe i2 dose manager user manual – Get to know dose manager
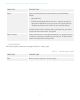
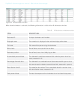
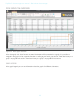
Figure 15. Graph legend
SELECTIONS IN A DOSE GRAPH
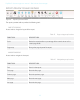
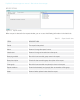
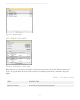
Figure 16. A selection in a dose graph
Make selections in a dose graph to analyze a certain time span further, see section “Make a selection in a
graph” on page 41. When you have made a selection, the following information is available in the graph
legend:
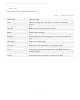
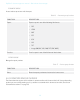
Table 22. Dose graph selections
ITEM DESCRIPTION
Selection summary An overall description about the selection.