
User guide

20
RaySafe i2 dose manager user manual – Get to know dose manager
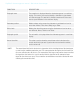
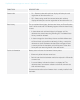
FUNCTION DESCRIPTION
Show details Checked: The graphs will display dose rate samples for every second,
where such data is available. Unchecked: the graphs will display mean
dose rate values per hour.
Events Show/hide events, such as synchronization occasions, in the dose
graph.
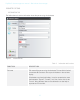
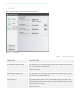
Graph options Enter the graph options dialog (small icon in the lower right corner
of the graph detail group), where you can access the graph visibility
settings and select to show/hide:
• Real time display to dosimeter synchronization occasions.
• Cradle to dose manager synchronization occasions.
• Session reset occasions.
• Event labels.
• Accumulated dose.
• Dose rate.
• Details.
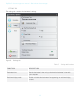
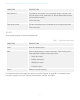
EXPORT GROUP
The Export group allows you to export the dose table.
Table 11. Export group functions
FUNCTION DESCRIPTION
Export to clipboard Copy all data from the dose table to clipboard.