
Instruction manual


CHAPTER 3 Operating Procedures
3 - 19
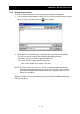
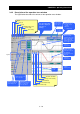
3.4.2 Description of the operation trace window
The figure below describes the contents of the operation trace window:
A
nalog 1
display area
Data value at t
1
-axis
cursor position
t
1
-axis cursor
When you hold
down the left mouse
button and drag the
mouse within the
drawing window, the
cursor appears.
Trigger
point
Display based on
t
1
-/t
2
-axis cursor
t: Time
difference
1/t: Fre
q
uenc
y
t
2
-axis cursor
When you right-
click the mouse in
the drawing
window, the cursor
appears.
Time display
based on t
1
-
axis cursor
Time axis
display
When you remove
the check mark, the
graph disappears.
Open
Save As
Print
Start Operation Trace
Clear Graph
Trace Setup
Y
ou can assign a title.
(The title is displayed
at the time of
printing.)
A
nalog 2
display area
Digital
display area
Data value
difference between
the t
1
- and t
2
-axis
cursor positions
Time-Axis Scroll Bar
Change Y-Axis Scaling
Clear Window
Zoom Out One Step
Zoom In One Step
Legend