
Installation guide


Appendix B: Debugging and Diagnosing FlashCONNECT Configuration
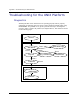
152 FlashCONNECT Administrator’s Guide
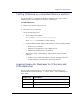
Enabling and Disabling the w3Debugging Tool
There are three methods that can be used to enable or disable the w3Debugging
tool. Although each method has a slightly different scope, they can be used
together.
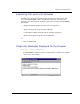
1. Within the URL:
http://yourwebhost.rainingdata.com/cgi-bin/
fccgi.exe?w3exec=boo&w3Debug=1
Debugging starts when this URL is received. Debugging stops when reset or when
the application ends by returning to WWW-IRUN.
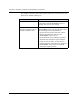
2. Call w3DebugOK
w3DebugOK controls caching of templates and substitution arrays, turns on and
off incoming data and outgoing forms dumping, and controls restarting a port in
the debugger with w3Monitor. See the D3 Reference Manual for additional
information about this routine.
3. Within the w3Apps file, add the letter d to the options value. For example:
Option: d
Debugging starts when the application is started. Debugging stops when reset or
when the application ends by returning to WWW-IRUN.
Entries are written to w3Logs,Dump in pairs. The first entry shows the outgoing
HTML code and the second entry shows the incoming form/CGI variables. Under
some circumstances, either entry can be empty. This also displays incoming and
outgoing information to the D3 screen.
In addition, the incoming form values of the request are displayed but the
variables are not displayed. When a reply is sent, the outgoing data is displayed.
Since it is possible for a field from a Web page to have the same name as a CGI/
Environment variable, the letter E is inserted in front of the CGI/Environment
variables and the letter V is inserted in front of the Web page fields.