
Manual
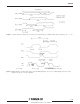
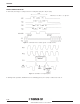
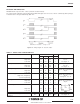
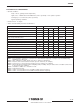
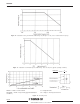
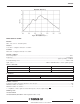
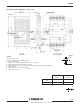

Figure 12 : Saturation level by full well with antiblooming out (F
A
high = 0 volt) vs the vertical transfer frequency.
Figure 13 : Saturation level limitation by the antiblooming effect on the pixel (Typical operating conditions)
Figure 14 : Smearing effect
12/16
TH7888A
V
V
N
T
T
H
SMEARING
SAT
ESAT
V
I
=××
N
ESAT
= number of times E
SAT
with E
SAT
=V
SAT
/ Responsivity (typical illumination
conditions)
T
I
= integration time
T
V
= image to memory transfer time