
User guide

15
TH7887A
2146A–IMAGE–05/02
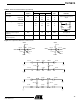
Notes: 1. Pixel saturation (full well) as a function of vertical transfer frequency (see Figure 14) and antiblooming adjustment (see Fig-
ure 15).
2. After subtraction of dark signal slope due to memory readout time.
3. First line level referenced from inactive prescan elements (17 samples).
4. Last line level referenced from inactive prescan elements(17 samples).
5. Measured with Correlated Double Sampling (CDS) including 160 µV readout noise and dark current noise in the general test
conditions.
6. Saturation to RMS noise in darkness ratio.
7. At Nyquist frequency.
8. VSAT/2 measurement and 1.25 MHz vertical transfer frequency.
9. VSAT/2 measurement and 20 MHz horizontal transfer frequency.
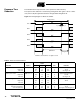
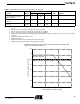
Figure 14. Saturation Level by full well with antiblooming out (ΦAhigh=0V)
vs the Vertical Transfer Frequency
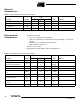
Horizontal modulation transfer
function at 500 nm
MTF – 70 – %
(7)
Vertical charge transfer
inefficiency
VCTI ––2.10
-5 (8)
Horizontal charge transfer
inefficiency
HCTI ––7.10
-5 (9)
Table 4. Electro-Optical Performance Characteristics (Continued)
Parameter Symbol
Value
Unit RemarksMin Typ Max
0
200
Vertical Transfer Frequency (KHz)
Saturation Output Level (Volts)
1200700 1700
1
0.5
1.5
2
2.5
3
3.5
Readout stage limit