
User Manual

9
TH7841A
1998A–IMAGE–05/02
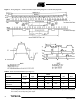
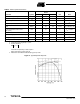
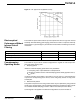
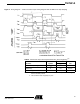
Figure 4. Timing Diagram — Clocks and Video Output Timing Diagram With and Without On-chip Sampling
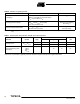
Notes: 1. Electro-optical performances obtained with complementary modes are not guaran-
teed for standard products.
2. The Conversion factor is typically 1.8 µV/e-.
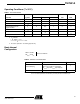
Table 8. Performance Improvement with External Φ
RA
, Φ
RB
Configuration
(1)(2)
Parameter Symbol
Values
Unit(Typ)
Saturation Output Voltage V
SAT
2.0 V
Responsivity R 5.0 V/µJ/cm
2
Dynamic Range DR 8,000