
User Manual

6
TH7841A
1998A–IMAGE–05/02
Notes: 1. Value measured with respect to zero reference level (see Figure 1).
2. Conversion factor is typically 1.1 µV/e-.
3. ∆R/R is defined as
where RA is responsivity of video output A
RB is responsivity of video output B
4. Measured in Correlated Double Sampling (C.D.S.) mode.
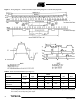
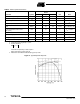
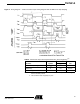
Figure 2. Typical Spectral Response
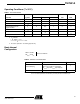
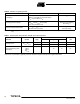
Table 5. Electro-optical Performance
Parameter Symbol
Values
Unit NoteMin Typ Max
Saturation Output Voltage V
SAT
1.3 1.8 2.2 V
(1)(2)
Saturation Exposure E
SAT
0.33 µJ/cm
2
Responsivity R 2.5 2.9 V/µJ/cm
2
Responsivity Unbalance ∆R/R 2 8 %
(3)
Photo-response No-uniformity Peak-to-
peak
PRNU ±5 ±10 % V
OS
V
OS
=50mVto1V
Contrast Transfer Function at FN
(38 I p/mm)
CTF 70 % V
OS
= 0.75V
Temporal Noise in Darkness 160 µVrms
(4)
Dynamic Range (Relative to rms Noise) DR 3000 6000
Average Dark Signal V
DS
0.08 0.5 mV
(1)
Dark Signal Non-uniformity DSNU 0.15 0.5 mV
200 RA RB–
RA RB+
------ ----------------- -----------