8
TH7813A/TH7814A
1990A–IMAGE–05/02
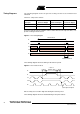
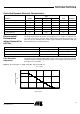
Spectral Responsivity The following curve shows the typical responsivity for TH7813A and TH7814A.
Figure 8. Spectral Responsivity
0
2
4
6
8
10
12
200 300 400 500 600 700 800 900 1000 1100
Wavelength (nm)
Responsivity
(V/µJ/cm
2
)