
User guide


13
ATA5811/ATA5812 [Preliminary]
4689B–RKE–04/04
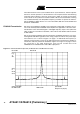
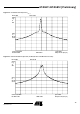
Figure 9 shows narrow band blocking and Figure 10 wide band blocking characteristics.
The measurements were done with a useful signal of 433.92 MHz/FSK/
20
kBaud/±16 kHz/Manchester with a level of -106 dBm + 3 dB = -103 dBm which is
3
dB above the sensitivity level. The figures show how much a continuous wave signal
can be larger than -103
dBm until the BER is higher than 10
-3
. The measurements were
done at the 50
Ω input according to Figure 7 on page 10. At 1 MHz, for example, the
blocker can be 56 dB higher than -103 dBm which is -103 dBm + 56 dB = -47 dBm.
These values, together with the good intermodulation performance, avoid the need for a
SAW filter in the key fob application.
Figure 9. Narrow Band 3 dB Blocking Characteristic at 433.92 MHz
Figure 10. Wide Band 3 dB Blocking Characteristic at 433.92 MHz
Figure 11 on page 14 shows the blocking measurement close to the received frequency
to illustrate the selectivity and image rejection. This measurement was done 6 dB above
the sensitivity level with a useful signal of 433.92 MHz/FSK/20kBaud/±16 kHz/
Manchester with a level of -106 dBm + 6 dB = -100 dBm. The figure shows to which
extent a continuous wave signal can surpass -100 dBm until the BER is higher than
10
-3
. For example, at 1 MHz the blocker can than be 59 dB higher than -100 dBm which
is -100 dBm + 59 dB = -41 dBm.
-10,0
0,0
10,0
20,0
30,0
40,0
50,0
60,0
70,0
-5,0 -4,0 -3,0 -2,0 -1,0 0,0 1,0 2,0 3,0 4,0 5,0
Distance of Interfering to Receiving Signal [MHz]
Blocking Level [dBC]
-10,0
0,0
10,0
20,0
30,0
40,0
50,0
60,0
70,0
80,0
-50,0 -40,0 -30,0 -20,0 -10,0 0,0 10,0 20,0 30,0 40,0 50,0
Distance of Interfering to Receiving Signal [MHz]
Blocking Level [dBC]