
Owner manual


3.0 Applications Information (Continued)
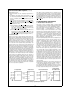
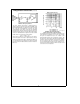
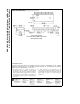
TL/H/11225–23
FIGURE 5. Analog Input Model
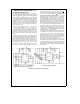
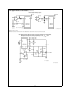
The curve ‘‘Signal to Noise Ratio vs. Output Frequency’’
(Figure 6)
gives an indication of the usable bandwidth of the
ADC10154/ADC10158. The signal-to-noise ratio of an ideal
A/D is the ratio of the RMS value of the full scale input
signal amplitude to the value of the total error amplitude
(including noise) caused by the transfer function of the A/D.
An ideal 10-bit plus sign A/D converter with a total unadjust-
ed error of 0 LSB would have a signal-to-noise ratio of about
68 dB, which can be derived from the equation:
S/N
e
6.02(n)
a
1.8
where S/N is in dB and n is the number of bits.
Figure 2
shows the signal-to-noise ratio vs. input frequency of a typi-
cal ADC10154/ADC10158 with (/2 LSB total unadjusted er-
ror. The dotted lines show signal-to-noise ratios for an ideal
(noiseless) 10-bit A/D with 0 LSB error and an A/D with a 1
LSB error.
SNR vs Input Frequency
TL/H/11225–24
FIGURE 6. ADC10154/ADC10158
Signal-to-Noise Ratio vs Input Frequency
The sample-and-hold error specifications are included in the
error and timing specifications of the A/D. The hold step
and gain error sample/hold specs are included in the
ADC10154/ADC10158’s total unadjusted, linearity, gain
and offset error specifications, while the hold settling time is
included in the A/D’s maximum conversion time specifica-
tion. The hold droop rate can be thought of as being zero
since an unlimited amount of time can pass between a con-
version and the reading of data. The data is lost after a new
conversion has been completed.
21