
User's Manual Part 2


Chapter 5 Diagnostics and Troubleshooting WinLink 1000 Installation and Operation Manual
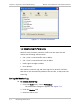
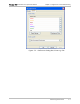
5.3 Viewing Performance Reports
The Performance Monitor Report displays performance views of each of
the interfaces
1
(see
Figure
5-4
). Several performance data are collected
for each of the interfaces (ES, SES, and UAS), as well as Specific data per
Interface type (e.g., TX and RX bytes for Ethernet). For the Air Interface,
user defined thresholds data are collected. Refer to
Table
5-1
and
Table
5-2
.
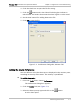
Data is collected and selectively displayed based on three time intervals
as selected by the Interval radio buttons:
• Current (t=0)
• 15 minutes Intervals
• Daily.
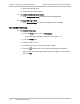
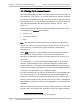
UAS – This parameter counts the time the air link was not providing
any service. There are several potential reasons for this situation; one
of the sites has a power failure, high interference, maintenance
operation etc.
Radio BBER Threshold – This parameter counts the seconds in which
the radio performance is below a user specified threshold. The
threshold is measured in percent. The threshold can be set from 0.1%
up to 50%.
For links with E1/T1 service the recommended value is 1% (system
default). Excellent TDM service is expected below the 1% threshold,
meaning that for 1% threshold, the expected BBER value should be 0 if
there are no problems during the 15 min interval. If the BBER threshold
increases some degraded service might be noticed.
For links with Ethernet only service, 8% threshold is recommended and
not 1% meaning that for 8% threshold, the recommended BBER value
should be 0 if there are no problems during the 15 min interval. Since
WinLink 1000 provides a loss less Ethernet service, there is throughput
degradation in case of interference. The degradation is proportional to
the BBER.
Radio RSS Threshold can also be used to indicate problems in the radio
channel. After verifying the RSS according to the link budget calculator
1
Ethernet performance is not collected in PoE systems.
5-6 Viewing Performance Reports