
System information

Chapter 6 Performance Management IPmux-8/16 User’s Manual
6-16 Viewing CT3 Port Statistics
Viewing CT3 Port Intervals Statistics
If more than one measurement interval has passed since the IPmux startup or
reset, you can view a selected 15-minute interval or cumulative totals of the data
from the previous 24 hours in a graph or a table.
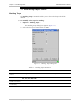
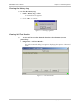
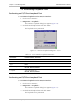
To view a list of statistics from previous intervals:
1. Click a CT3 port:
2. Statistics > Intervals…
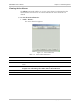
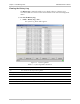
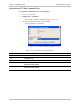
The channelized T3 Intervals Statistics dialog box appears.
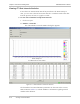
Figure 6-9. Channelized T3 Intervals Statistics
The channelized T3 Intervals Statistics parameters are the same as the Current
Data Parameters (Table 6-7) with the addition of information regarding Interval
number and its duration.