
- RAD Data Communications TDMoIP Gateway Installation and Operation Manual
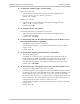
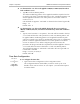
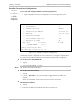

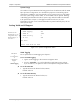
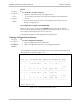
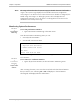
Table Of Contents
- Contents
- Introduction
- Installation
- Operation
- Introduction
- Front Panel Controls, Connectors, and Indicators
- Operating Instructions
- Getting Started
- Menu Operations
- Configuring System Parameters
- Configuring IPmux-16
- Troubleshooting and Diagnostics
- Boot Sequence for Downloading Software
- SNMP Management
- Telnet
- TFTP Download Procedures
- DC Power Supply Connection – CBL-DC-3WL/F

Chapter 3 Operation IPmux-16 Installation and Operation Manual
3-38 Configuring IPmux-16
The Usage column describes the System Usage per bundle. The total of all bundle
usages is the System Usage displayed in the Bundle Connection Configuration
screen (Figure 3-32). When a cross-connect between two bundles is configured, the
Bundle Usage Percentage is 0. Although a positive value is displayed in the
Configuration Summary screen, this value is not being taken into account in the
calculation of the total System Usage.
Monitoring System Performance
Main Menu
↓
3. Performance
Monitoring
➤
To view performance statistics:
• Type 3 (Performance Monitoring) in the Main menu.
From the Performance Monitoring menu you can:
• View Physical Port Statistics
• View Bundle Connection Status
PERFORMANCE MONITORING
1. Physical Port Statistics
2. Bundle Connection Status
ESC. Exit
Select item from the menu.
Figure 3-35. Performance Monitoring Menu
E1/T1 Statistics
Main Menu
↓
3. Performance
Monitoring
↓
1. Physical Port
Statistics
➤
To view E1/T1 or Ethernet statistics:
• Type 1 (Physical Port Statistics) in the Performance Monitoring menu.
After accessing this menu, Press 1 to choose and select the slot/channel statistics
that you wish to view. Choosing 3/X or 4/X will display E1 channel statistics.
Choosing 1/1 will display Ethernet card statistics.
Note