
Specifications


Chapter 6 Diagnostics and Troubleshooting Installation and Operation Manual
6-2 Monitoring Performance IPmux-24 Ver. 1.5
³ To view the E1/T1 statistics:
1. From the Monitoring menu (
Figure
6-7
), select Statistics.
The Statistics menu appears (
Figure
6-1
).
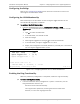
2. From the Statistics menu, select TDM physical Layer.
The TDM physical Layer (E1) or Physical Layer (T1) screen appears (see
Figure
6-2
).
3. From the TDM physical layer (E1/T1) menu, type F to select the E1/T1 link
that you intend to monitor.
4. Select Interval, enter the number of the interval whose statistics you wish to
display, and press Enter
or
Type ^B (Shift+Ctrl+B) to scroll backward or ^F (Shift+Ctrl+F) to scroll forward
through the available intervals.
Statistics
1. TDM physical layer >
2. Connection >
3. Bridge >
>
Please select item <1 to 3>
ESC-prev.menu; !-main menu; &-exit 1 Mngr/s
Figure
6-1. Statistics Menu
Monitoring>Statistics>TDM physical layer (E1)
Channel ID (1)
LOS: (0) DM: (0)
LOF (Red): (0) ES: (0)
LCV: (0) SES: (0)
RAI (Yellow): (0) UAS: (0)
AIS: (0) LOMF: (0)
FEBE: (0)
BES: (0)
Time Since (sec): (366) Valid Intervals: (96)
1. Interval ... (0)
F - Forward; ^B - Prev Interval; ^F - Next Interval
ESC-prev.menu; !-main menu; &-exit
Figure
6-2. E1/T1 Statistics