
System information


User's Manual Chapter 2 Installation and Setup
RADview-SC/TDMoIP IPmux-11 Using the GUI 2-5
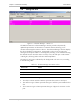
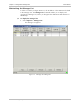
Selecting the Device or a Port
By selecting a row, you can manipulate or manage the selected system or port.
When selected, a light blue frame is displayed around the selected window, and
the background color of the selected row is dark gray. Only one row can be
selected at a time.
There are two IPmux-11 user interface object levels:
• System (whole device) – contains all of the parameters and functions that are
common to the whole device.
• Port – contains all of the parameters and functions of the selected port.
To select the entire device (system):
• In the Element Manager window, click the System row.
To select a port:
• In the Element Manager window, click the row of the desired port.
Status Indicators
At the top of the window, the title bar displays <element name>:<status>,
where status is either Connected or Disconnected, according to the current
connectivity of the network element to the NMS.
At the bottom of the Element Manager window, there is also a communications
status bar. Sometimes, congestion in the network handling the management traffic
causes significant delays during polling, transfer of large data tables, etc. When
feasible, a progress bar is used to inform the operator of the ongoing process
status. Otherwise, a message is displayed in the status bar at the bottom of the
screen, according to the following table.
Table 2-2. Element Manager Status Bar Messages
Message Status
Working...
Displayed from the moment when a request is sent to the network
element (IPmux-11), until data is received or a certain time expires
(around 5 seconds).
Waiting...
Displayed while the RADview station waits more than a few seconds
for the network element response, but less than the time-out time.
Interrupted
When all attempts to communicate with network element failed (time-
out), or when the response was an SNMP error.
Ready
Displayed after the process has been successfully completed.