
User's Manual
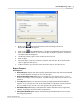
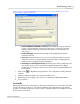
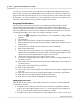
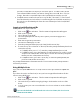
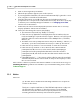
Table Of Contents

Results/Reports
62
Qwizdom Actionpoint 2007
1.
Click on the
Reports/Results
button in the floating toolbar. The
Reports/Results
window appears.
2.
Click on the
Report Wizard
button. The
Reporting
Wizard
window will appear.
3.
Click on the
Browse
button to search for the file you want to generate a report for.
The
Open
window will appear.
4.
The file type will be
.QRX
. Search for the file and select it.
5.
Click on
Open
.
6.
Select the type of report you want to generate and click
OK
.
Microsoft Excel
will
open to generate the report.
7.
In
Microsoft Excel
, go to the
File
menu and select
Save
to save the report.
Report Features
Excel Reports:
·
Answer Report
-displays bar chart and lists participant names, ID, and remote ID with
score and breakdown of responses for each question.
·
Answer Distribution Report
-shows a percentage for each answer choice, correct
answer, percentage of correct answers , and the average of the answer sent for each
question.
·
Score Report
-displays bar chart and shows the participant information with the
number of correct responses out of the total number of questions answered and in
the presentation. Also, shows score and spontaneous question totals.
·
Attendance Report
-displays participant information with their remote login time,
number of questions answered and total questions.
·
Participant Detail Report
-displays detailed participant information such as name,
ID, and group number.