
User's Manual
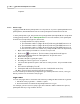
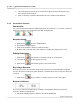
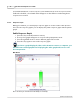
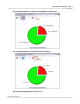
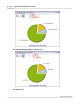
Table Of Contents

Qwizdom Actionpoint User Guide47
Qwizdom Actionpoint 2007
check mark
will indicate a correct response, an
X
will indicate an incorrect response. If the
feedback is disabled, a
check mark
and
X
will appear on the LCD screen indicating that a
response was received.
5.5.2.1 Response Graph
During presentation, you can display a response graph to see the results of the question.
There are two response graphs you can display: the public response graph and the private
graph.
Public Response Graph
1.
Press the
/
key on the RF instructor remote.
2.
The response graph will appear on screen for the participants to view.
3.
Press the right/left arrows to view a different graph of the results.
4.
Press the
/
key again to remove the response graph.
If you have a graph displayed, either on the instructor remote or computer, you
must first remove that graph before displaying the other graph and/or move onto
the next question.
Bar Chart
Press circle key to show bars horizontally or vertically.