
User's Guide
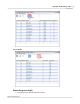
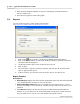
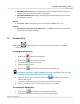
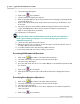
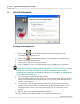
Table Of Contents

Question Bar
56
Qwizdom Actionpoint 2007
14.
Repeat steps 9 through 14 until the presentation is complete.
15.
Click on the
Utilities
button and select
Exit
.
16.
The saved results will generate in the location that was designated.
A report for the saved results can be generated within the
Results/Reports
window of
Qwizdom Connect
.
Question Bar (with Instructor Remote)
1.
Click on the
Question Bar
button in the floating toolbar. The
Presentation
Setup
window appears.
2.
The
Presentation Setup
window appears.
3.
Click on the
Participant
List
drop-down field and select what type of participant list
you would like to use.
4.
Click on the
Saved
Results
drop-down field and select how you would like to save
the results.
5.
Select the options you would like available during presentation in the
General
,
Login
, and
Display
tabs in the lower part of the
Presentation Setup
window.
6.
Click on
OK
to begin the presentation.
7.
The
Question Bar
will appear at the top of the screen.
8.
Press the
New Q
button on the instructor remote. A list of question types will
appear on the LCD.
9.
Use the arrows on the thumb pad to scroll through the different question types.
10.
Press the
Send
or C
ircle
key (in thumb pad) to select the question type.
11.
You can select the correct answer and press
Send
; or press
Send
without selecting a
correct answer (survey).
12.
Participants will send their responses.
The response graph can be displaying during and after the posed question by
pressing the / (graph) key on the instructor remote.
13.
When time is up or when the question has been answered, press the
New Q
button
again to pose another question.
14.
Repeat steps 8-11 until the presentation is complete.
15.
Click on the
Utilities
button and select
Exit
.
16.
The saved results will generate in the location that was designated.