
User guide

© 2011 Cisco Systems, Inc. All rights reserved. This document is Cisco Public Information. Cisco Validated Design Page 129
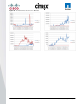
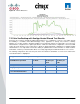
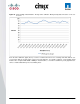
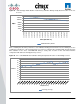
Figure 68. Citrix XenApp Virtual Machine Total Memory Utilization During Steady-State Execution of 45 User
Sessions
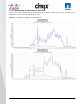
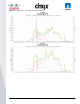
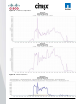
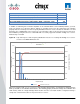
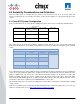
After concluding that the CPU performance of the individual XenApp virtual machine was the limiting factor, the
overall CPU performance of the hosting hypervisor needs to be evaluated. The following graph provides Average
CPU Utilization for the Cisco UCS B200 M2 during a steady state execution for the four–virtual machine
configuration with 180 active XenApp desktop sessions.
Figure 69. Cisco UCS B200 M2 CPU Utilization during Steady State Execution of 180 XenApp sessions
0
2000
4000
6000
8000
10000
12000
14000
11:19:00
11:21:03
11:23:06
11:25:10
11:27:12
11:29:15
11:31:18
11:33:21
11:35:24
11:37:27
11:39:30
11:41:34
11:43:37
11:45:40
11:47:43
11:49:47
11:51:51
KBps
Time (hh:mm:ss)
Total Memory Used
0
10
20
30
40
50
60
70
80
90
100
Percent
Time(hh:mm:ss)
CPU Usage (Average)