
User guide

© 2011 Cisco Systems, Inc. All rights reserved. This document is Cisco Public Information. Cisco Validated Design Page 127
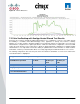
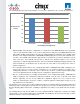
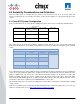
Total Sessions Launched
180
Uncorrected Optimal Performance Index (UOPI)
180
Stuck Session Count before UOPI(SSC)
2
Lost Session Count before UOPI (LSC)
0
Corrected Optimal Performance Index (COPI = UOPI – (SSC*50%) - LSC)
179
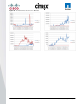
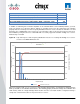
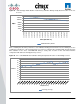
In addition to evaluating the successful completion of the workload within a user‘s desktop session, you must
make sure that the user experience did not degrade as load was increased on the environment. The following
graph provides the VSI Response Time Frequency Distribution which is used to calculate the VSI Max score and
determines the scalability limits of the system. As seen in the figure, 100% of the measured response times were
below 2000ms proving that the Cisco UCS B200 M2 successfully supported 180 Citrix XenApp user sessions
without being overloaded.
Figure 66. Login VSI Response Time Frequency Distribution measure for executing 180 XenApp user sessions
on a Cisco UCS B200 M2 Blade Server
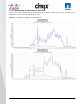
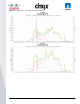
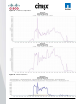
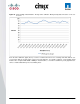
When assessing the limit of user sessions per single XenApp virtual machine, it‘s important to assess both the
Memory and CPU of an individual virtual machine. The following graphs provide the ‗average CPU utilization‘ and
‗total memory used‘ for a single XenApp virtual machine from the four–virtual machine configuration during a
steady state of workload execution for the peak of 45 user sessions.
0.00%
20.00%
40.00%
60.00%
80.00%
100.00%
120.00%
0
500
1000
1500
2000
2500
0
200
400
600
800
1000
1200
1400
1600
1800
2000
2200
2400
2600
2800
3000
3200
3400
3600
3800
4000
4200
4400
4600
4800
5000
Cumulative Percentage of Response Times
Frequency of Response Times
Response time (ms)
VSI Response Time Freqency Distribution
Below 2000ms: 100%
Frequency
Cumulative Frequency (%)