
User guide

© 2011 Cisco Systems, Inc. All rights reserved. This document is Cisco Public Information. Cisco Validated Design Page 117
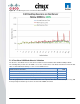
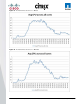
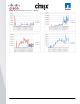
a single XenServer. Each virtual desktop was configured with 1.5 GB of RAM. With 110 virtual desktops utilizing
1.5 GB of RAM per virtual desktop, 165GB of the available memory is consumed by virtual desktops. The
variance between 165GB and the line shown on the graph is the amount of memory being utilized by the
XenServer hypervisor.
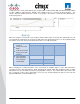
When assessing the overall results of the testing is that the VM per CPU core density was maintained across all
test environment configurations. As shown in the table below, the VM density per CPU core was maintained while
the number of hosts was increased showing a linear CPU core to VM density ratio.
Windows7 pooled
desktops
1vCPU and 1.5GB
RAM.
3 GB PVS Cache/OS
Paging File on NFS
Volumes
XenServer 5.6
No. of Servers Tested
No. of VMs
VMs/Core
Cisco UCS B250
M2s w/ Dual Six
Core (3.33GHz)
192GiB RAM
1 Blade
110
9.16
8 Blades
880
16 Blades
1760
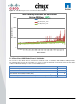
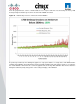
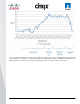
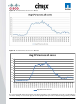
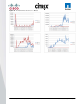
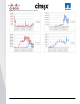
When evaluating the overall performance of the environment for validation purposes is the NIC performance
especially given the SAN dependencies. When assessing the network traffic with XenServer Pools, it‘s again
important to note the role that the XenServer is playing within each pool. The network data represented as bits
per second in this section is first separated by resource pool role, and then displays the data for each of the four
physical 10GbE NICs on that individual server