
User guide

© 2011 Cisco Systems, Inc. All rights reserved. This document is Cisco Public Information. Cisco Validated Design Page 116
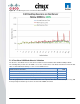
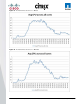
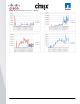
Figure 55. XenServer Resource Pool 2 – Master
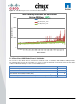
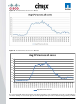
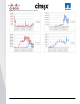
Figure 56. XenServer Resource Pool 2 – Member
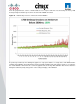
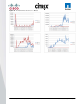
As seen in this graph below, the majority of the physical memory of the single blade server was consumed by the
110 active desktop sessions. Each grey circle in the graph below represents a virtual desktop powering on within
0
0.1
0.2
0.3
0.4
0.5
0.6
0.7
0.8
0.9
1
14:23:16
14:27:19
14:31:23
14:35:27
14:39:33
14:43:38
14:47:45
14:51:53
14:56:01
15:00:05
15:04:09
15:08:16
15:12:19
15:16:23
15:20:27
15:24:36
15:28:42
15:32:48
15:36:53
15:40:58
15:45:03
15:49:08
15:53:12
15:57:17
16:01:21
16:05:25
16:09:29
16:13:33
16:17:35
16:21:38
Avg CPU across all cores
Avg CPU across all cores