
User guide

© 2011 Cisco Systems, Inc. All rights reserved. This document is Cisco Public Information. Cisco Validated Design Page 113
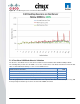
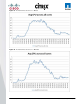
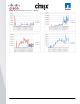
From the graph below, it can be concluded that the user response time was not affected by the heavy 1760
desktop load given that all response times are below the 2000ms threshold.
Figure 52. 1760 Desktop Sessions on XenServer Below 2000ms
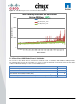
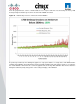
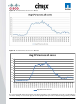
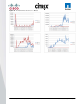
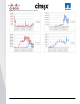
As previously mentioned, the following two graphs are only representative of a single Cisco UCS blade server‘s
‗average CPU utilization‘ and ‗total memory used‘ to provide a sample of the performance metrics as recorded for
the overall 16-blade environment. As seen in the graph below, the average CPU utilization was the most intensive
during the workload (steady state) portion of the testing averaging ~70% utilization.