
User guide


© 2011 Cisco Systems, Inc. All rights reserved. This document is Cisco Public Information. Cisco Validated Design Page 110
7.0 Test Results
The purpose of this testing is to provide the data needed to validate Citrix XenDesktop 4 FlexCast models Hosted
VDI and Hosted Shared with Citrix XenServer 5.6 virtualizing Microsoft Windows 7 desktops on Cisco UCS blade
servers using a NetApp FAS 3140 storage array. The test results are divided into the individual FlexCast models
Hosted VDI and Hosted Shared. The information contained in this section provides data points that a customer
may reference in designing their own implementations. These validation results are an example of what is
possible under the specific environment conditions outlined in this paper, and do not represent the full
characterization of XenDesktop with XenServer scalability.
7.1 Citrix XenDesktop Hosted VDI Test Results
This section details the results from the XenDesktop Hosted VDI validation testing. The primary success criteria
metrics are provided to validate the overall success of the test cycle. Additional graphs emphasizing the CPU and
Memory utilization during peak session load are also present given that Memory consumption was found to be the
most limiting factor to prevent further desktops from being hosted in both respective environments. The single
server graphs shown in this section are representative of a single XenServer in the larger environment for
validation purposes, but it should be noted that these graphs are representative of the behavior for all servers in
the respective environment.
7.1.1 Single Cisco UCS Blade Server Validation
The first process in the validation was to ensure that a single Cisco UCS blade server was able to support the
desired load of 110 virtual desktops per server. When identifying how many virtual desktops per server, it was
important to assess the total available RAM. Each virtual desktop was configured with 1.5 GB of RAM and each
blade had 192 GB of RAM available. With 110 virtual desktops on the server, the memory utilized on the
environment was slated to be 165 GB of RAM before any hypervisor overhead, therefore making memory ~85%
utilized. Based on this analysis the following 110 number of virtual desktops per blade was chosen.
Table 7 provides the VSI COPI score for the overall single Cisco UCS blade server environment and shows that
100 percent of all the 110 virtual desktop sessions executed without issue.
Table 7. Single Cisco UCS Blade Server Score
Total Sessions Launched
110
Uncorrected VSI Max (UOPI)
110
Stuck Session Count before UVM (SSC)
0
Lost Session Count before UVM (LSC)
0
Correct Optimal Performance Index (COPI = UOPI – (SSC*50%) – LSC)
110
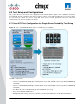
After it can be confirmed that all 110 sessions executed successfully, it is important to help ensure that the user
experience was not degraded as load was increased on the environment. The user response time, as reflected in
Login VSI Max Pass or Fail rating, provides the necessary guidance to evaluate the user experience based on
workload response time. From the graph below, it can be concluded that the user response time was not affected
by the heavy 110 desktop load given that all response times are below the 2000ms threshold.