
Installation guide


5–Validation Methods for DCB and FCoE
Validation Step 7—Virtualization Verification
51031-00 A 5-31
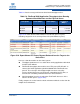
Table 5-6 lists the average minimum and maximum throughput values.
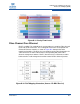
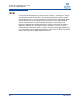
Figure 5-32 shows that the FCoE initiator issued 16 PFC pause requests,
indicating congestion on the converged host side (with VMware in place).
Figure 5-32. Expert Shows PFC Pause Request Released from the Target to the
Switch Port
Here are a few observations on the virtual system:
Throughput performance is less stable when running applications with virtual
machines than without.
FCoE traffic throughput decreased because PFC paused FCoE traffic. In
contrast, the iSCSI application gained bandwidth while FCoE traffic was
paused. These changes in throughput might have been caused by
increased virtual OS processing overhead, competition for CPU time, or
transmission scheduling conflicts between the virtual machines.
iSCSI throughput increases sharply when FCoE traffic decreases in the
absence of PFC pauses (Figure 5-31).
Finally, compare the results from the virtual environment with the results from the
multiple host environment.
Table 5-6. FCoE and iSCSI Application Throughput when Running
Separate Virtual Machines on One Physical Server
Test Option FCoE (MBps) iSCSI (MBps)
Combined
(MBps)
Average 835.819 166.289 999.367
Maximum 1182.395 653.632 1182.395
Minimum 367.888 0 371.988