
Installation guide

5–Validation Methods for DCB and FCoE
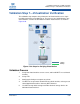
Validation Step 7—Virtualization Verification
5-30 51031-00 A
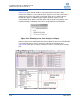
6. Configure the test as follows:
Trigger: any PFC frame
Post fill: 90 percent after the trigger
Data size: 512K
Traffic: 100 percent read on both virtual machines
7. Use Analyzer to capture a trace.
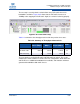
8. Use Expert to analyze the trace, and calculate the average, minimum, and
maximum throughput results per priority.
9. Compare I/O performance for the two virtual machines.
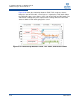
Repeat the entire test, using separate hosts for the iSCSI initiator and the FCoE
initiator, and compare I/O performance.
Validation Results
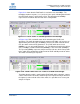
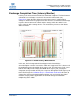
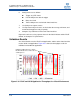
One virtual machine ran the FCoE read application, and the other virtual machine
ran the iSCSI read application. Figure 5-31 shows the throughput results for
individual and combined applications.
Figure 5-31. FCoE and iSCSI Application Throughput in a Virtual Environment
iSCSI throughput increases when
FCoE traffic decreases in the absence
of PFC pauses