
Installation guide

5–Validation Methods for DCB and FCoE
Validation Step 3—FCoE Function and I/O Tests
5-14 51031-00 A
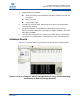
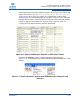
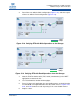
Similar to previous test results, the captured FCoE traces listed in Table 5-1 show
no FCoE frame errors.
The results show that the direct attached Fibre Channel storage topology and
Fibre Channel SAN storage topology share similar I/O performance. The
throughput is nearly 100 percent of total available bandwidth. These results prove
that the stateless FCoE overhead does not impact Fibre Channel SAN
performance.
The direct FCoE storage topology has higher available bandwidth (10GbE link),
so the throughput is higher at 641MBps. However, the bandwidth usage is only 64
percent of the total available bandwidth. The bandwidth may have been limited by
the storage device in this case, whereas it was limited by the network in the other
two cases. This conclusion is based on the Queue Depth and Data Size traffic
parameters.
No data integrity errors were detected by the MLTT tool in the three tests.
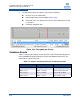
Table 5-1. I/O Performance Comparison Among FCoE Storage Network Scenarios
Topology
Option
Throughput
(MBps /
Percent of
Maximum
Bandwidth)
SCSI I/O
Statistics
Exchange Statistics Pending Exchange
IOPS
(IO/s)
Average
Read
Data
Time
Average
Completion
Time (ms)
Completion
Rate
(per sec)
Byte/
Exchange
Pending
I/O
(per sec)
Oldest
Pending
Read
(ms)
Direct
Attach
FCoE
Storage
641 / 64% 1168 5.28 5.73 1168 524,288 8 0.39
Direct
Attach
Fibre
Channel
Storage
390 / 98% 703 1.28 5.62 704 524,288 1 9.37
Fibre
Channel
SAN
Storage
390 / 98% 736 1.28 5.59 736 524,288 5 4.84