
User guide

6 Sun Storage Fibre Channel Switch 5802 QuickTools User Guide • September 2008
The fabric tree entry has a small icon next to it that uses color to indicate operational
status.
■ A green icon indicates normal operation.
■ A yellow icon indicates that a switch is operational, but may require attention to
maintain maximum performance.
■ A red icon indicates a potential failure or non-operational state as when the
switch is offline.
■ A blue icon indicates that a switch is unknown, unreachable, or unmanageable.
If the status of the fabric is not normal, the fabric icon in the fabric tree will indicate
the reason for the abnormal status. The same message is provided when you rest the
mouse on the fabric icon in the fabric tree.
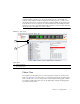
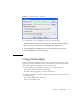
Graphic Window
The graphic window shows the switch faceplate (FIGURE 1-3) or backplate display.
The window height can be adjusted by clicking and dragging the window border
that it shares with the data window.
The faceplate display shows the front of a switch. To view the faceplate display, open
the View menu, and select View Faceplate. The backplate display shows the back of
the switch. To view the backplate display, open the View menu, and select View
Backplate.
Data Windows and Tabs
The data window (FIGURE 1-3) presents a table of data and statistics associated with
the selected tab for the switch displayed in the graphic window. Use the scroll bar to
browse through the data. The window length can be adjusted by clicking and
dragging the border that it shares with the graphic window. Adjust the column
width by moving the pointer over the column heading border shared by two
columns until a right/left arrow graphic is displayed. Click and drag the arrow to
the desired width. The data windows and tabs are described below.
■ Devices — displays information about devices (hosts and storage targets)
connected to the switch. Refer to Devices Data Window for more information.
■ Switch — displays current network and switch configuration data for the selected
switches. Refer to Using the Switch Data Window for more information.
■ Port Statistics — displays performance data for the selected ports. Refer to Port
Statistics Data Window for more information.
■ Port Information — displays information for the selected ports. Refer to Port
Information Data Window for more information.