
User guide

SN0430935-00 Rev. D 04/14 4
White Paper
QLogic 10000 Series Adapter Provides
Application Benets Through I/O Caching
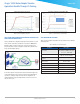
Figure 4: Four Server Database Query TPS
LOCAL CACHE VERSUS REMOTE CACHE EFFICIENCY OF QLOGIC 10000
SERIES ADAPTER REMOTE ACCESS
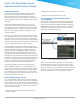
Figure5 identies the conguration testing the latency difference of local
versus remote cache (where a LUN cache is located in a 10000 Series
Adapter residing on another server). Test conclusions showed a nine
percent performance impact of slightly increased latency between local
versus remote database queries.
Figure 5: Local Versus Remote Test Conguration
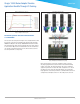
As shown in Figure6, the performance benchmark measured 0percent
cache against 30percent local caching, and the test repeated with the
operation of caching at 30percent in the remote conguration. No
signicant difference was perceived between local cache access and
remote cache access.
Figure 6: Local Versus Remote Cache Efciency
TEST HARDWARE AND SOFTWARE
Table1 lists the hardware and Table2 lists the software used for database
workload queries.
Table 1. Hardware Used for Exchange Query
Hardware Description
Host Server
Dual 6-core Intel Xeon CPU
E5-2640 at 2.50GHz, 24logical
processors, 32GB RAM
Host Bus Adapter
QLogic FabricCache 10000 Series
8Gb Fibre Channel Adapter
Quantity of Host Bus Adapters
per Host
1
Fabric Switch
QLogic 5800V/5802V 8Gbps Fibre
Channel Switch
Storage Array HP EVA 6300
Drive Speed 10K
Quantity of Drives on Array 24
LUN Size 100GB × 7
RAID Type RAID 5