
Owner's manual

SSG-WP13001D SN0430934-00 Rev. D 05/13 3
WHITE PAPER
Figure 1 shows the basic setup for the Exchange test.
Figure 1. Exchange Test Setup
Test Hardware and Software
Table 1 lists the hardware and Table 2 lists the software used for Exchange
Server testing.
Table 1. Hardware Used for Exchange Jetstress Testing
Hardware Description
Host Server Dual 6-core Intel Xeon CPU
E5-2640 at 2.50GHz, 24 logical
processors, 32GB RAM
Host Bus Adapter QLogic FabricCache 10000 Series
8Gb Fibre Channel Adapter
Quantity of Host Bus Adapters
per Host
1
Fabric Switch
QLogic
5800V/5802V 8Gbps Fibre
Channel Switch
Storage Array HP EVA 6300
Drive Speed 10K
Quantity of Drives on Array 24
LUN Size
100GB × 7
RAID Type RAID 5
Table 2. Software Used for Exchange Jetstress Testing
Software Description
Operating System Windows Server 2008 R2
Exchange Performance
Validation Tool
Exchange Jetstress 2010
64-bit version 14.01.0225.017
Exchange 2010 System
Simulation ESE.dll File
14.01.0218.012 (Microsoft
Exchange Server 2010 SP1)
Quantity of Mailboxes 1,000
Mailbox Size 200MB
Database Size 200GB
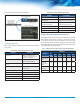
Exchange Performance Results Using Jetstress
The tests demonstrate that, at various levels of LUN caching in the 10000
Series Adapter, caching delivers as much as a 400 percent increase in
the number of IOPS and an 80 percent reduction in I/O latency. These
performance improvements are directly related to caching data closer to
the Exchange Server processor, which eliminates Fibre Channel transit time
over the SAN. Table 3 shows these results.
Table 3. Jetstress Data for Increasing Cache Sizes in the 10000 Series Adapter
Criteria
Cache Size
No
Cache
25% 30% 50% 75% 100%
Exchange I/O
Read Latency
(ms)
4.724 2.648 2.484 2.021 1.558 0.922
Exchange
Transactions
(IOPS)
1056 1819 2017 2277 3154 5270
Latency
Reduction
0% (44%) (47%) (57%) (67%) (80%)
IOPS Increase 0% 72% 91% 116% 199% 399%