
System information

69
The Statistics Menu
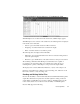
Bandwidth Utilization
Shows bandwidth usage statistics for your network.
Menu Path
Statistics ->Bandwidth Utilization. The mode starts immediately.
Purpose
Bandwidth Utilization is calculated by recording the number of bytes seen by the
Observer (or Probe) station over a 1-second interval. This value is then adjusted by
adding to the appropriate MAC header and footer data size information. From this
point, the amount of data is compared to the maximum theoretical throughput of your
NIC driver reports (i.e., 10MB, 100MB, or whatever your NIC card is reporting) and
a percentage statistic is displayed.
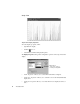
Bandwidth Utilization displays a graph that is an instantaneous “window” on your
bandwidth utilization. Information is real-time, although the graph will only display
up to 16 minutes of information. Sampling is once per second.
You cannot start or stop this mode. When the mode is displayed, it is automatically
started. To stop the mode, simply close the mode window. The Bandwidth Utilization
display can be viewed in graph, dial, list, 3D, or pie views. There is no setup dialog
for Bandwidth Utilization.
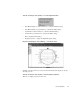
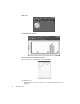
Once you are in the Bandwidth Utilization screen, the graph shows the current
bandwidth utilization. Maximum, average, and latest utilization values are shown at
the top of the graph.
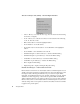
Available Views
• Graph View
•Dial View
• List View
• 3D Column Chart View