
System information


36
The Capture Menu
Additionally, since it is more efficient collecting only partial packets, if you are
having trouble keeping up with your bandwidth, setting this to a lower number
will help keep CPU utilization (per captured packet) at a minimum.
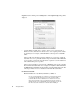
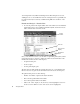
• “Partial packet header size” spinbox—indicates the actual number of bytes per
packet Observer will capture. Minimum = 16; maximum =10,000.
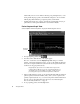
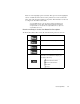
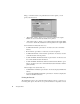
Packet Capture-Graph View
Select Capture > Packet Capture to display the Packet Capture window.
1. To begin capturing packets, click .
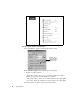
2. You will see three different lines on the capture graph.
The color of each line is set in the Display Properties dialog. See “Packet
Capture – Graph View Display Properties” on page 37. By default, the blue line
shows the non-captured traffic. The yellow line shows the captured traffic. The
red line shows dropped packets (if any).
Dropped packets represent an error condition that is not part of the
normal operation of Observer. If you are seeing dropped packets you
should begin to check your hardware for conflicts, or make sure your
processing power is up to the minimum requirements of Observer.
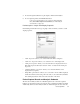
3. Observer will display the percent of your capture buffer that is full, the number of
packets captured, and the current filter (if any). Once you have captured some
quantity of packets (at least one), you can view the packets with the V
IEW button.
You can only save the packet buffer from the viewer. See “Packet Capture-
Decode and Analysis Submode” on page 37.
4. To stop capturing packets, click the Stop button.
Dropped
packets