
System information


416
Observer Suite: RMON Console
RMON Probe and modify the read and write community string (if necessary). Once this
information is entered, click on the O
K button.
RMON Console Configuration Options
See “Adding/Configuring an RMON Probe” on page 263.
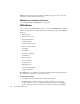
RMON Modes
Once a connection to an RMON Probe is made, you can view the RMON Probe’s data in a
number of familiar Observer formats. The Observer modes that are supported for RMON
Probes are:
• Packet Capture
• Packet View (Decode)
• Bandwidth Utilization
• Utilization History
• Utilization Thermometer
• Network Activity Display
• Vital Signs
•Top Talkers
• Pair Statistics (Matrix)
• Web Observer
•Router Observer
• Protocol Statistics
• IP Subprotocols
• IPX Subprotocols
• Discover Network Names
• Triggers and Alarms
Most RMON modes are identical to their Observer Advanced Probe counterparts. For all
modes, subtractions, additions, and notes (if any) follow.
Packet Capture Mode
• Comparative Standard Observer Mode Functionality: Identical
• RMON Limitations: Filters are subject to your Probe’s ability to create offsets;
dropped packets are not shown. When transferring packet buffers from the RMON
Probe to Observer, the buffer is transferred one packet at a time (as per the RMON