
System information


415
Observer Suite: RMON Console
RMON Console is a part of Network Instruments’ Observer Suite bringing the RMON
(Remote Monitoring) standard to the Observer console.
Introduction to the RMON Console
Observer Suite’s RMON Console allows you to view any RMON1/2 Probe’s RMON data
from within the Observer interface. The RMON data can be viewed in familiar Observer
mode formats or in a pure RMON1/2 table format.
Viewing RMON data in Observer’s familiar mode format lets you see your Probe’s data
without trying to decipher the complexity of the different RMON variables and RMON
variable formats. Note that not all Observer modes are available using RMON because of
the standards-based nature of the RMON data.
If the RMON Request for Comments (RFCs) do not provide a specific metric for
Observer, then it cannot be displayed. Notes on what standard Observer mode metrics are
missing can be found later in this section. See “RMON Modes” on page 416.
If you need to view all RMON variables in their native format, the RMON table provides a
complete RMON data listing.
With Observer and the RMON Extension you can:
• View any RMON1/2 Probe’s data from within the Observer interface.
• Manage any RMON enabled device from within Observer.
Using the RMON Console
Once Observer Suite has been activated (by entering the appropriate license numbers),
Observer is ready to make a connection to an RMON Probe.
Connecting to a Probe
Unlike using an Advanced Observer Probe, when using RMON Probes, the Observer
console must initiate a connection to the Probe.
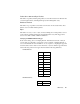
A number of parameters are required to initiate the connection. Start by selecting
Actions
> Add RMON Probe
from Observer’s main menu. This will display the RMON Probe
Configuration dialog. To initiate a connection, you must enter an IP address of the