
System information

412
Observer Suite: Web Reporting
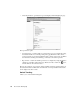
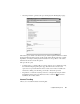
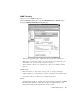
• “Average in time intervals” checkbox—if selected, the report will capture the average
in time intervals you have selected in the “Averaging for tables” combo box. You can
select the data to be displayed as a chart and/or a table. You may also select to display
all items or only selected items using the radio buttons in the “Notes” column.
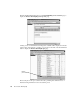
• “Enter a note to include in the report” textbox—allows you to enter a note for
inclusion in the report.
• Show Report button—generates the report and displays the Trending Report page.
• Export in XML button—exports the report to XML.
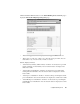
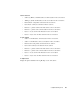
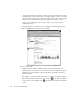
The report has two parts:
• Summary Section—contains a tabular summary of the report. Each item in the
summary table section represents one report item, and is also hotlinked to the chart or
table that it represents. Clicking on the item will bring you directly to the chart or
table it represents.
• Report Items—contains the actual chart or table report items, as configured with the
Report Properties button. Each section also contains a icon, which is hotlinked
to the contents section. Clicking on the icon will bring you back to the summary
section.