
System information

406
Observer Suite: Web Reporting
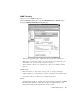
• “Switch IP group protocol distribution” checkbox—if selected, the report will capture
switch IP group protocol distribution. You can select the data to be displayed as a
chart and/or a table.
• “Switch IP applications distribution” checkbox—if selected, the report will capture
switch IP applications distribution. You can select the data to be displayed as a chart
and/or a table.
• “Switch IPX subprotocol distribution” checkbox—if selected, the report will capture
switch IPX subprotocol distribution. You can select the data to be displayed as a chart
and/or a table.
• “Switch errors distribution” checkbox—if selected, the report will capture network
errors distribution. You can select the data to be displayed as a chart and/or a table.
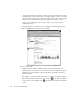
• “Switch top talkers” checkbox—if selected, the report will capture top talkers. Data is
displayed as a pie chart only.
• “Port errors distribution” checkbox—if selected, the report will capture port error
distribution. Data is displayed as a pie chart.
• “Transparent chart/pie background” checkbox—if selected, the report chart (if
defined) will have a transparent background.
• “Enter a note to include in the report” textbox—allows you to enter a note for
inclusion in the report.