
System information


402
Observer Suite: Web Reporting
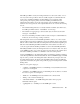
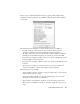
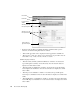
• Probe list—lists the Probes (including the built-in, local Probe that is part of
Observer) for which trending data has been collected.
• “Dates with logged data” chart—displays the dates logged data is available for.
• “Report period” combo box—allows you to select the report period time. You can
select either: 1 day, 1 week, 2 weeks, 1 month, or custom.
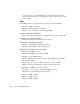
Statistic, Display, and Notes:
• “Network activity summary (traffic and utilization)” checkbox—if selected, the
report will capture a summary of network activity. You can select the data to be
displayed as a chart and/or a table.
• “Network packet size distribution” checkbox—if selected, the report will capture
network packet size distribution. You can select the data to be displayed as a chart
and/or a table.
• “Network protocol distribution” checkbox—if selected, the report will capture
network protocol distribution. You can select the data to be displayed as a chart and/or
a table.
• “Network IP subprotocol distribution” checkbox—if selected, the report will capture
network IP subprotocol distribution. You can select the data to be displayed as a chart
and/or a table.
Probe list
Logged data
dates
Home link
Allows you to set
the report period
Allows you to set
the report items
Click button to
generate report